The whole system, end to end.
Write down what your mail or your accounting system needs to work: which servers and ports, which outside services, where it moves if the main site fails. Link the pieces, and the map draws itself.

Picture a normal Monday. The mail server is slow, nobody remembers what else runs on it, and the list of servers lives in a spreadsheet last updated in spring. AverDesk puts your IT in one place: what you have, what depends on what, and who is working on which problem. Three months free for one IT person, then $30 a year.
Without AverDesk, it usually goes like this.
A server runs the mail. Sales use the mail to talk to clients. When the server stops, the phone rings, one person opens the spreadsheet, another scrolls through the chat, and a third tries to remember who set it up. AverDesk keeps these links written down, so the team sees at once who is affected and works on the problem in one place.
A description that stays true
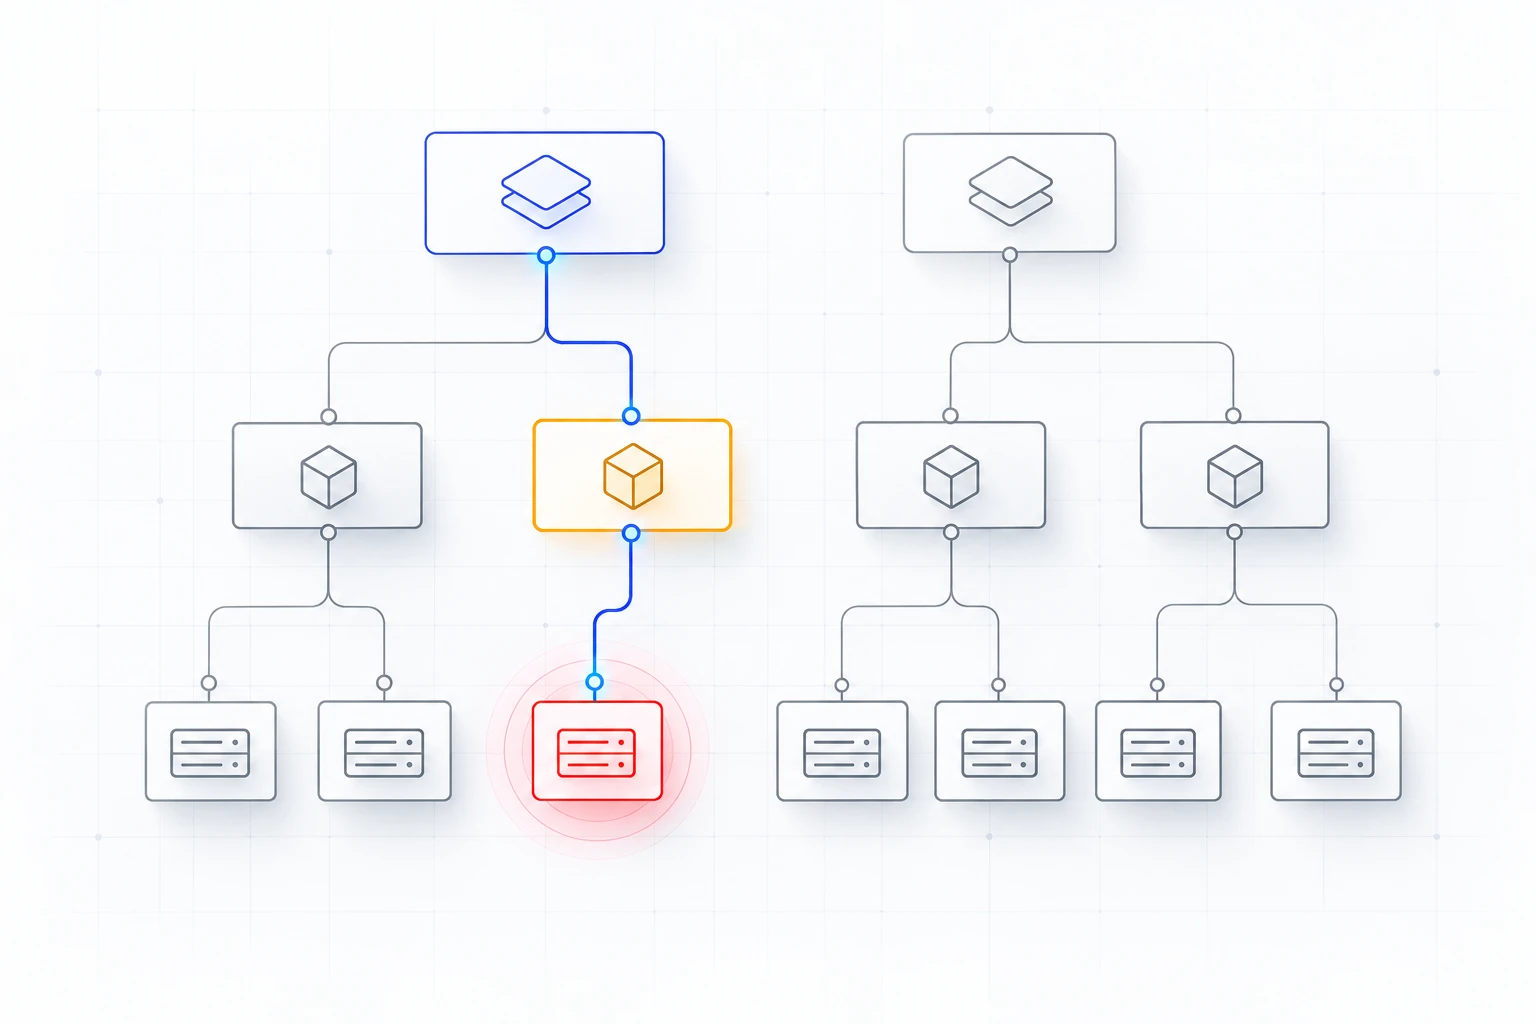
Most teams have a diagram in a wiki. A week after someone draws it, it is already wrong: a server got replaced, a port changed, and nobody redrew the picture. In AverDesk the description of a system is the record your team already works with. Servers, the network ports they use, the outside services they call and the backup site they move to in an emergency are ordinary entries that people update as they work (IT people call this a service model).
Write down what your mail or your accounting system needs to work: which servers and ports, which outside services, where it moves if the main site fails. Link the pieces, and the map draws itself.
Support, developers and security look at the same up-to-date picture. When someone changes a server or a link during their work, the description changes too, because it is the same record.
Before you restart a server, see what runs on it. Before you open a port, see who already uses it. The team weighs the risk of a change before making it.
Fill it in by hand, load spreadsheets (CSV or JSON files), or send data from your own scripts through the API. Right now we are building automatic data collection through agents.
See how dependencies work
This is where AverDesk earns its place. A red ring marks the server that went down. The map shows which services ran on it and who will feel it. The team opens one incident and works in it, with the conversation, the deadlines for the first reply and the fix (SLA timers) and the affected systems side by side.

Know what you have
Laptops, servers, services, licences, IP addresses, offices and the people responsible for them sit in one connected list. It stays accurate because engineers work in it every day. Nobody has to update a separate register once a quarter.
See the IT inventoryThe printer on the second floor stops, so an employee writes a request. The mail server goes down, so the team opens an incident. Each one is tied to that exact printer or server, with a timer for the promised reply and fix time (SLA) and any planned maintenance in view.
See the service desk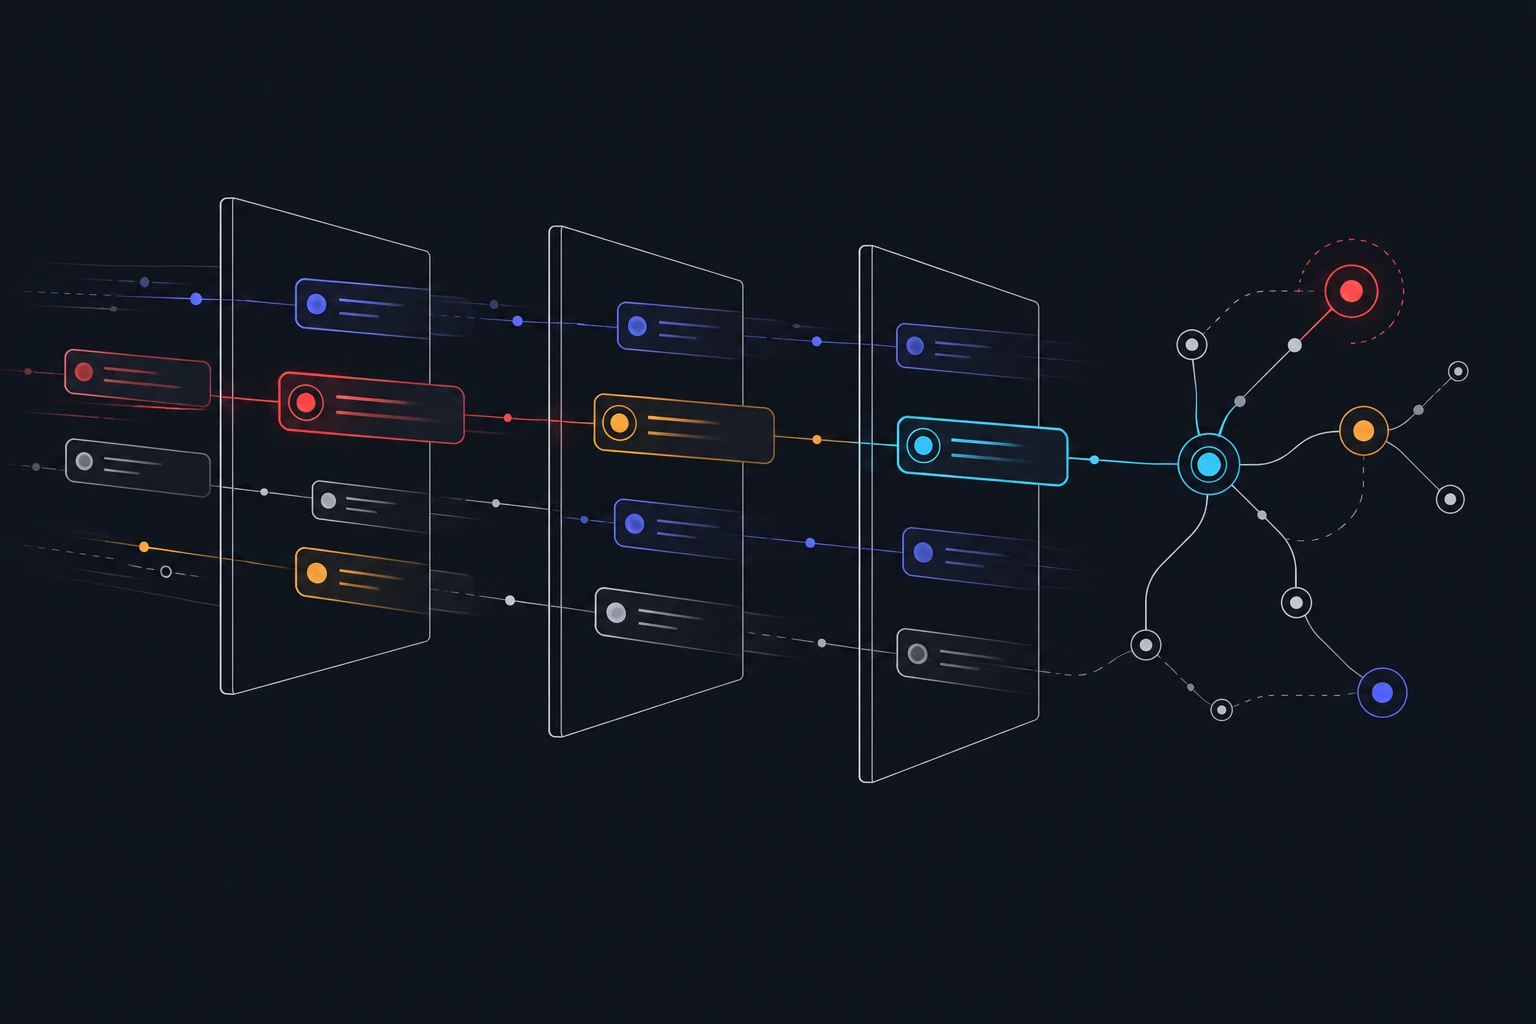
A new employee joins on Monday. Their account already exists in your company directory (Active Directory or LDAP), and AverDesk reads it from there through a small agent that only sends data out. Spreadsheets load as CSV or JSON files. Your own scripts can work through the API.
Runs on Windows or Linux. You open no inbound ports.

Your situation is probably one of these.
A few rules we built in from the start.
People who only order things and follow their requests never cost you anything.
An engineer who works in several organizations is still one paid seat.
If you have no access to something, you don’t see it. If an action is refused, the app tells you why.
Every organization has its own database. One subscription can hold many of them. We, the vendor, cannot look inside yours.
The app works in English, Ukrainian and Russian.
$30
On the Personal plan one IT person gets a working organization, a demo organization to try things on, and a one-time 45-day trial of the Standard plan. The first 3 months are free, then it is $30 a year. Add your first servers this afternoon, and by tomorrow morning you will see what depends on what. Employees who use the self-service portal are free on every plan.
Compare plans
02:10. The database server is down.
The night engineer sees a red ring on the database server. Red means a real outage. Planned work shows in orange, so nobody confuses it with the update announced for tomorrow.
Server down
See dependencies in detail